Engineering & Technical Info
Performance Charts
A New Concept in Control Valve Sizing
By Stephen D. Jernigan, P.E., OCV V.P. Engineering
Most engineers and users of control valves are familiar with the flow charts that various manufacturers-OCV included-have published as a guide to properly sizing a valve. These are simple, straight-line graphs that plot pressure drop vs. flow for a wide-open valve of a given size. Quite frankly, the usefulness of such charts is rather limited because of a couple of factors:
- Flow charts tell you virtually nothing about the performance of modulating valves (pressure reducing, rate-of-flow control, etc.). These are valves that rarely, if ever, reach the wide-open position depicted in conventional flow charts.
2. Flow charts are not entirely accurate for many on-off valves (e.g., check, solenoid) which operate on line pressure differential. Such valves normally contain an internal spring which takes a certain amount of differential to compress before the valve can reach the full-open position. In these cases, conventional flow charts are not accurate at the low flow end of the scale.
In 1984, with the publication of the Pressure Reducing Valve Sizing Guide, OCV Control Valves began a program to give the user a better and more accurate method of sizing valves. The ultimate goal of the program was to provide a simple, concise “tool” that would apply to sizing all valves. The culmination is the Performance Charts presented in the following pages.
In 1995, OCV released the computer-based ValveMaster Selection and Size Program. The program logically walks you through the sizing, valve function and material selection process of a hydraulic control valve application. Your valve specification can be printed and/or transferred to a project specification file. The program exposes the variables of control valve selection and reduces the amount of time required to accurately size and select the valve. Refer to the last page of this catalog for ordering information.
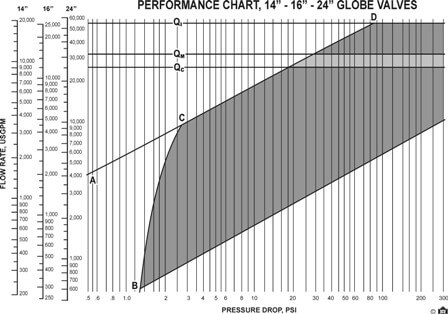
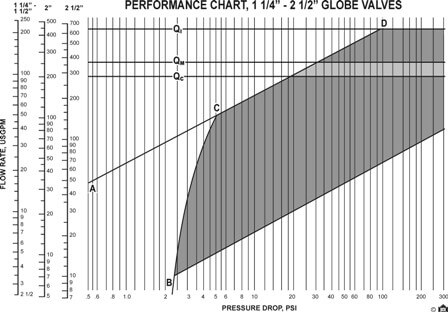
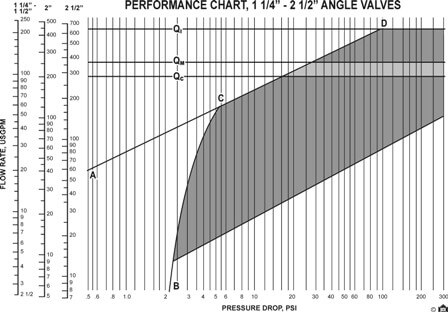
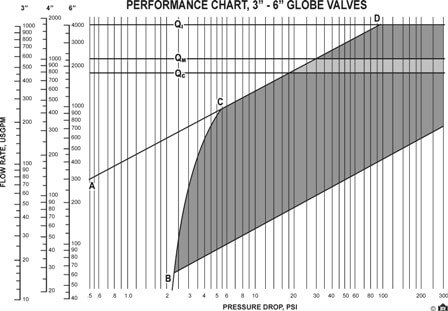
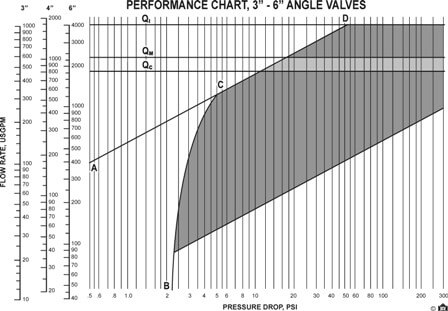
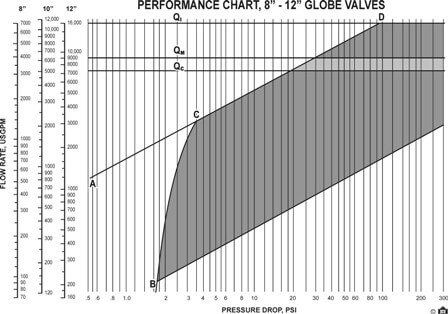
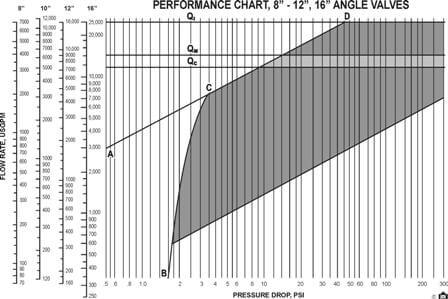
At first glance, the Performance Charts appear much like the old flow charts, but with several extra lines added! Because of the added information represented by the extra lines, only two or three different sizes of valves are presented on an individual Performance Chart, each with its own flow rate scale.
In explaining how to use the Performance Charts, we need to consider three “classes” of valves.
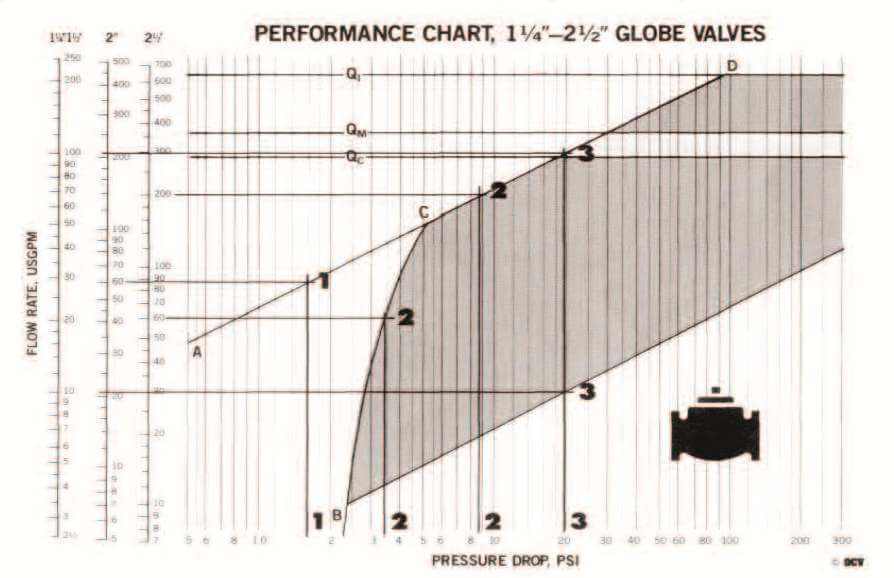
1. The first class of valves includes those Models based on the Model 66 power-actuated valve (Model 125-27 and Model 126) and other valves with a pilot system that exhausts-to-atmosphere (Model 3331 and Model 3333 altitude valves). These valves will open fully regardless of flow or pressure differential. Their performance is represented by the straight line A-C-D (which, incidentally, is the same straight line found on the old flow charts).
Example: Find the pressure drop of a 2” Model 125-27 globe valve at 60 gpm.
Solution: Find 60 gpm on the 2” flow rate scale and trace horizontally to line A-C-D. Then tracevertically to the pressure drop scale and read 1.6 psi.
2. The second class of valves is the on-off types with a pilot system that exhausts to the downstream side of the valve. In this class are the Series 94 check valves, the Series 115 solenoid valves, the Models 125 and 125-7 pump control valves and the Model 8000 float valve. These valves operate along lines B-C-D, the B-C segment representing the “spring effect” described earlier.
Example: Find the pressure drop of a 2” Model 115-2 globe valve at 60 gpm and at 200 gpm.
Solution: Trace horizontally from 60 gpm on the 2” globe flow rate scale. This intersects line B-C, indicating the valve is not full open. Drop vertically to the flow rate scale and read 3.5 psi. Now trace horizontally from 200 gpm. This intersects line C-D (the valve is full open). Drop vertically to the pressure drop scale and read 8.7 psi.
3. The third class of valves are the modulating types: Series 108 Pressure Relief, Series 110 Differential Control, Series 120 Rate-of-Flow Control, Series 127 Pressure-Reducing and Series 8101 Modulating-Float Control. Here performance is not defined by a line, but rather an area of the chart — specifically the shaded area. Simply stated, a modulating valve can be expected to perform properly anywhere within the shaded area.
Example: Find the effective flow range of a 2” globe relief valve relieving 20 psi into an atmospheric drain.
Solution: Upstream pressure is 20 psi, downstream is zero. Therefore, pressure drop is 20 psi. Trace upward until you intersect the lower edge of the shaded area. Then, trace horizontally to the 2” flow rate chart and read 21 gpm. This is the minimum flow. Now continue upward along the 20 psi line to the upper edge of the shaded area. Trace horizontally and read a maximum flow of 210 gpm. The effective flow range, then, is 21-210 gpm.
A final set of information is given by the horizontal lines labeled QC, QI. These are the maximum recommended flows based on fluid velocity.
QC represents a velocity of 20 ft/sec and is the maximum recommended flow for continuous service.
QM represents a velocity of 25 ft/sec and is the maximum recommended flow for occasional “bursts” of high flow that would occur no more than 20% of the time.
QI represents a velocity of 45 ft/sec and is the maximum recommended flow for very intermittent service — no more than 1-2% of the time. It is primarily intended for surge relief service.
Performance Charts
PERFORMANCE CHART, 1 1/4″ – 2 1/2″ GLOBE VALVES
PERFORMANCE CHART, 1 1/4″ – 2 1/2″ ANGLE VALVES
PERFORMANCE CHART, 3″ – 6″ GLOBE VALVES
PERFORMANCE CHART, 3″ – 6″ ANGLE VALVES
PERFORMANCE CHART, 8″ – 12″ GLOBE VALVES
PERFORMANCE CHART, 8″ – 12″, 16″ ANGLE VALVES
PERFORMANCE CHART, 14″ – 16″ – 24″ GLOBE VALVES
